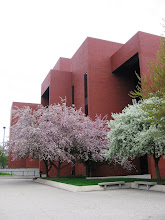
University Libraries Finish a Great Year, FY 2005-2006
Since the end of the second summer session, I, like many University Libraries’ personnel, have been moving a research project forward, taking some vacation time, and preparing for the coming fall semester.
Already many faculty are back on campus and the University Libraries’ personnel are busy helping them to arrange for e-Reserves, preparing streaming music reserves, verifying class reading lists, and preparing library instructional materials for use in classes.
Along with meeting with academic department heads and college deans about the University Libraries’ programs, services, and collections, I have been reviewing data and our activities over the past year. One highlight from the data shows that for fiscal year (2005-06) our turnstile count was 1,269,412 which is an increase of 11.6% over the same period a year earlier. This count shows that students and faculty choose the University Libraries as the place for their research and learning. It shows, too, that the University Libraries are actively and increasingly contributing to the academic life of the campus since this is the third year in a row for a double-digit percentage increase.
To provide better services, we strive to learn about our students, faculty, and staff by capturing and collecting data through observation, extraction from various databases, and the use of electronic equipment and devices.
In particular, we analyze our circulation records and data about who logs into the public computer workstations and who prints documents on the public printers in the University Libraries in terms of our users’ classification, (e.g., freshmen, sophomore, junior, senior, graduate, postgraduate), faculty (full-time, contract, adjunct), staff (full-time, temporary), emeriti (faculty, staff).
During Spring Semester 2006, the data show 48.2% [or 1,602 of the enrolled freshmen] borrowed something from the University Libraries.
Other data shows that these 1,602 freshmen checked-out 16,630 items, which we also analyze as part of collection development to determine what it is that freshmen students are borrowing. By comparing it to data from earlier periods, we are able to measure the impact of efforts to attract underserved groups by increasing awareness about programs, services, and collections.


0 Comments:
Post a Comment
<< Home